a baseline compiler for guile
Greets, my peeps! Today's article is on a new compiler for Guile. I made things better by making things worse!
The new compiler is a "baseline compiler", in the spirit of what modern web browsers use to get things running quickly. It is a very simple compiler whose goal is speed of compilation, not speed of generated code.
Honestly I didn't think Guile needed such a thing. Guile's distribution model isn't like the web, where every page you visit requires the browser to compile fresh hot mess; in Guile I thought it would be reasonable for someone to compile once and run many times. I was never happy with compile latency but I thought it was inevitable and anyway amortized over time. Turns out I was wrong on both points!
The straw that broke the camel's back was Guix, which defines the graph of all installable packages in an operating system using Scheme code. Lately it has been apparent that when you update the set of available packages via a "guix pull", Guix would spend too much time compiling the Scheme modules that contain the package graph.
The funny thing is that it's not important that the package definitions be optimized; they just need to be compiled in a basic way so that they are quick to load. This is the essential use-case for a baseline compiler: instead of trying to make an optimizing compiler go fast by turning off all the optimizations, just write a different compiler that goes from a high-level intermediate representation straight to code.
So that's what I did!
it don't do much
The baseline compiler skips any kind of flow analysis: there's no closure optimization, no contification, no unboxing of tagged numbers, no type inference, no control-flow optimizations, and so on. The only whole-program analysis that is done is a basic free-variables analysis so that closures can capture variables, as well as assignment conversion. Otherwise the baseline compiler just does a traversal over programs as terms of a simple tree intermediate language, emitting bytecode as it goes.
Interestingly the quality of the code produced at optimization level -O0 is pretty much the same.
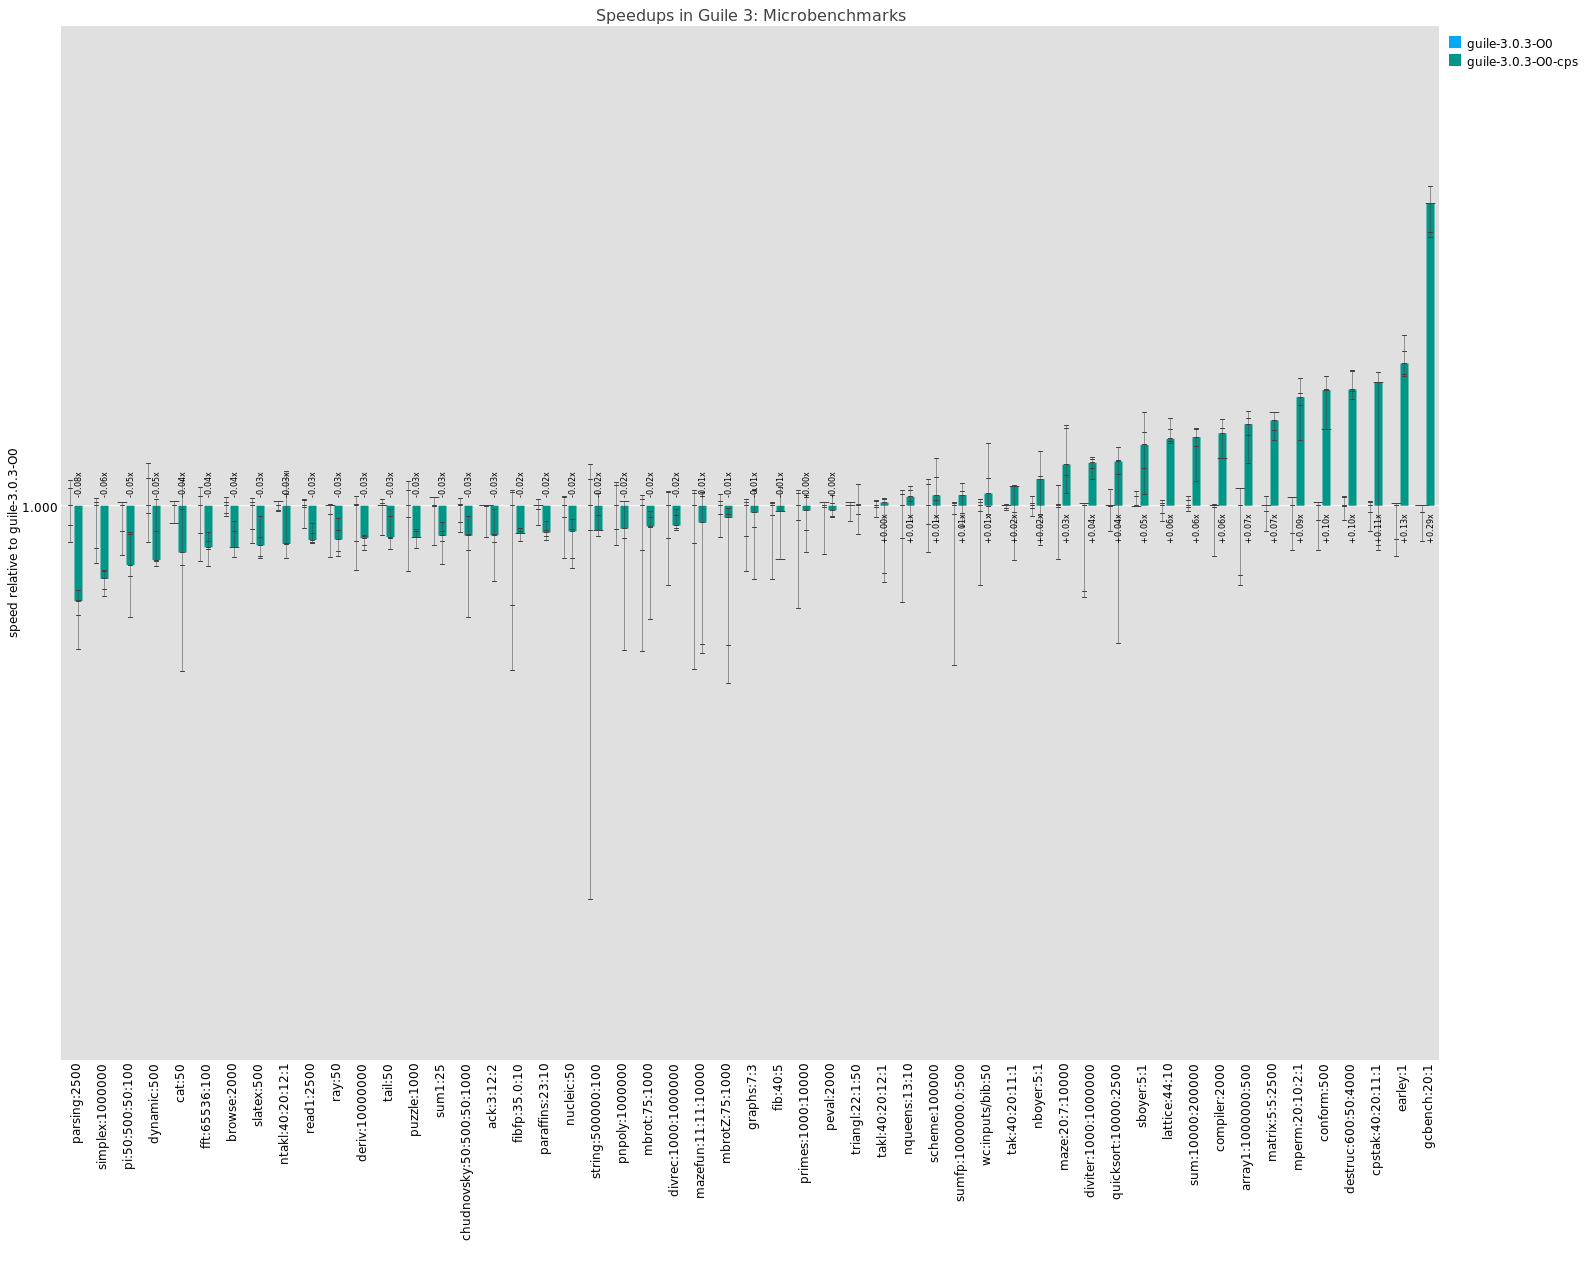
This graph shows generated code performance of the CPS compiler relative to new baseline compiler, at optimization level 0. Bars below the line mean the CPS compiler produces slower code. Bars above mean CPS makes faster code. You can click and zoom in for details. Note that the Y axis is logarithmic.
The tests in which -O0 CPS wins are mostly because the CPS-based compiler does a robust closure optimization pass that reduces allocation rate.
At optimization level -O1, which adds partial evaluation over the high-level tree intermediate language and support for inlining "primitive calls" like + and so on, I am not sure why CPS peels out in the lead. No additional important optimizations are enabled in CPS at that level. That's probably something to look into.
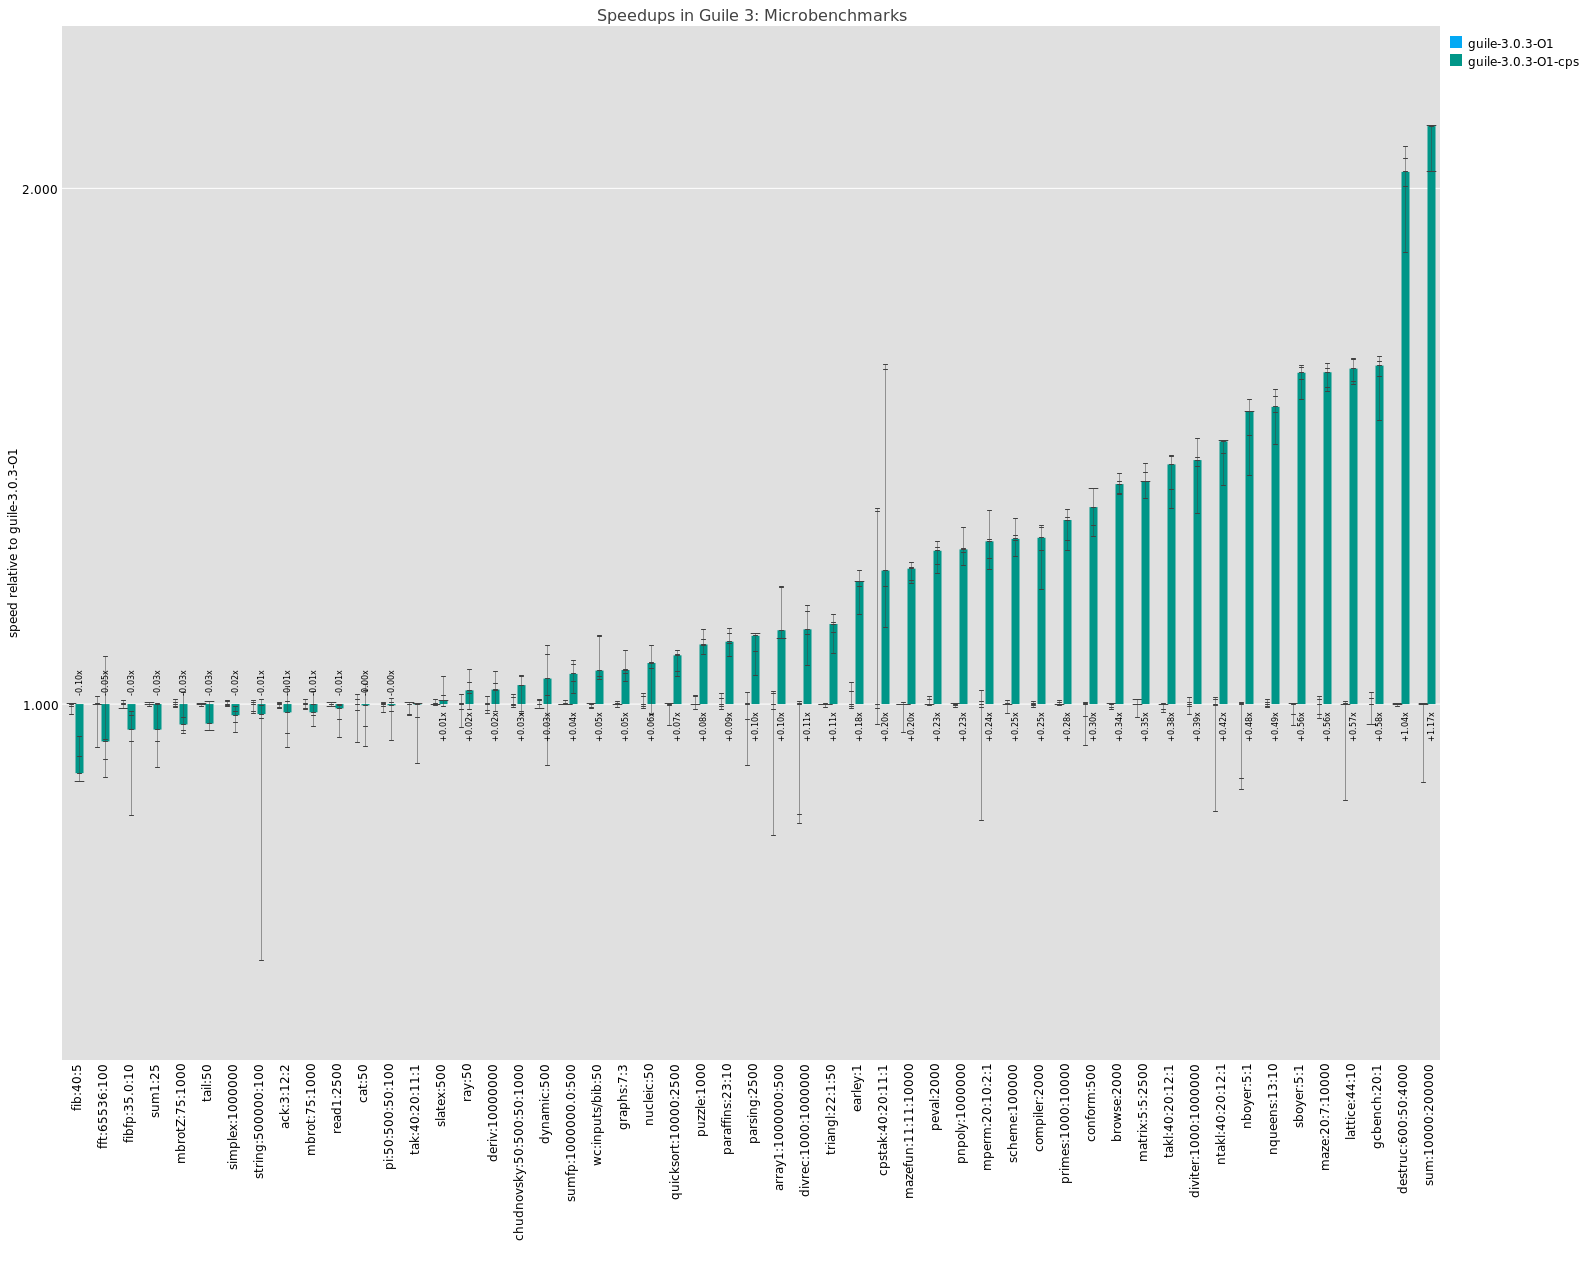
Note that the baseline of this graph is optimization level -O1, with the new baseline compiler.
But as I mentioned, I didn't write the baseline compiler to produce fast code; I wrote it to produce code fast. So does it actually go fast?
Well against the -O0 and -O1 configurations of the CPS compiler, it does excellently:
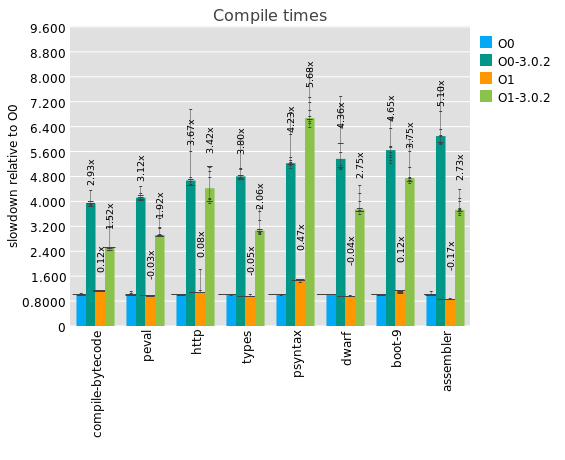
Here you can see comparisons between what will be Guile 3.0.3's -O0 and -O1, compared against their equivalents in 3.0.2. (In 3.0.2 the -O1 equivalent is actually -O1 -Oresolve-primitives, if you are following along at home.) What you can see is that at these optimization levels, for these 8 files, the baseline compiler is around 4 times as fast.
If we compare to Guile 3.0.3's default -O2 optimization level, or -O3, we see bigger disparities:
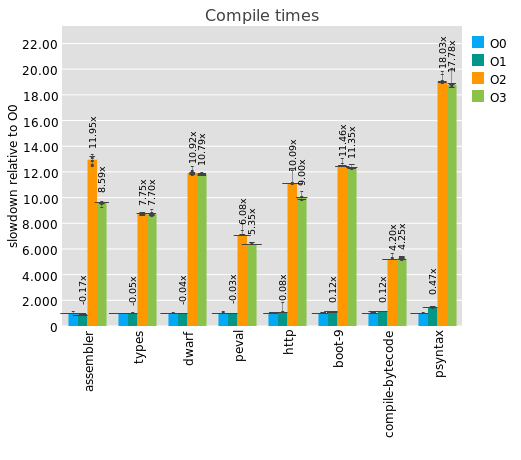
Which is to say that Guile's baseline compiler runs at about 10x the speed of its optimizing compiler, which incidentally is similar to what I found for WebAssembly compilers a while back.
Also of note is that -O0 and -O1 take essentially the same time, with -O1 often taking less time than -O0. This is because partial evaluation can make the program smaller, at a cost of being less straightforward to debug.
Similarly, -O3 usually takes less time than -O2. This is because -O3 is allowed to assume top-level bindings that aren't exported from a module can be transformed to lexical bindings, which are more available for contification and inlining, which usually leads to smaller programs; it is a similar debugging/performance tradeoff to the -O0/-O1 case.
But what does one gain when choosing to spend 10 times more on compilation? Here I have a gnarly graph that plots performance on some microbenchmarks for all the different optimization levels.
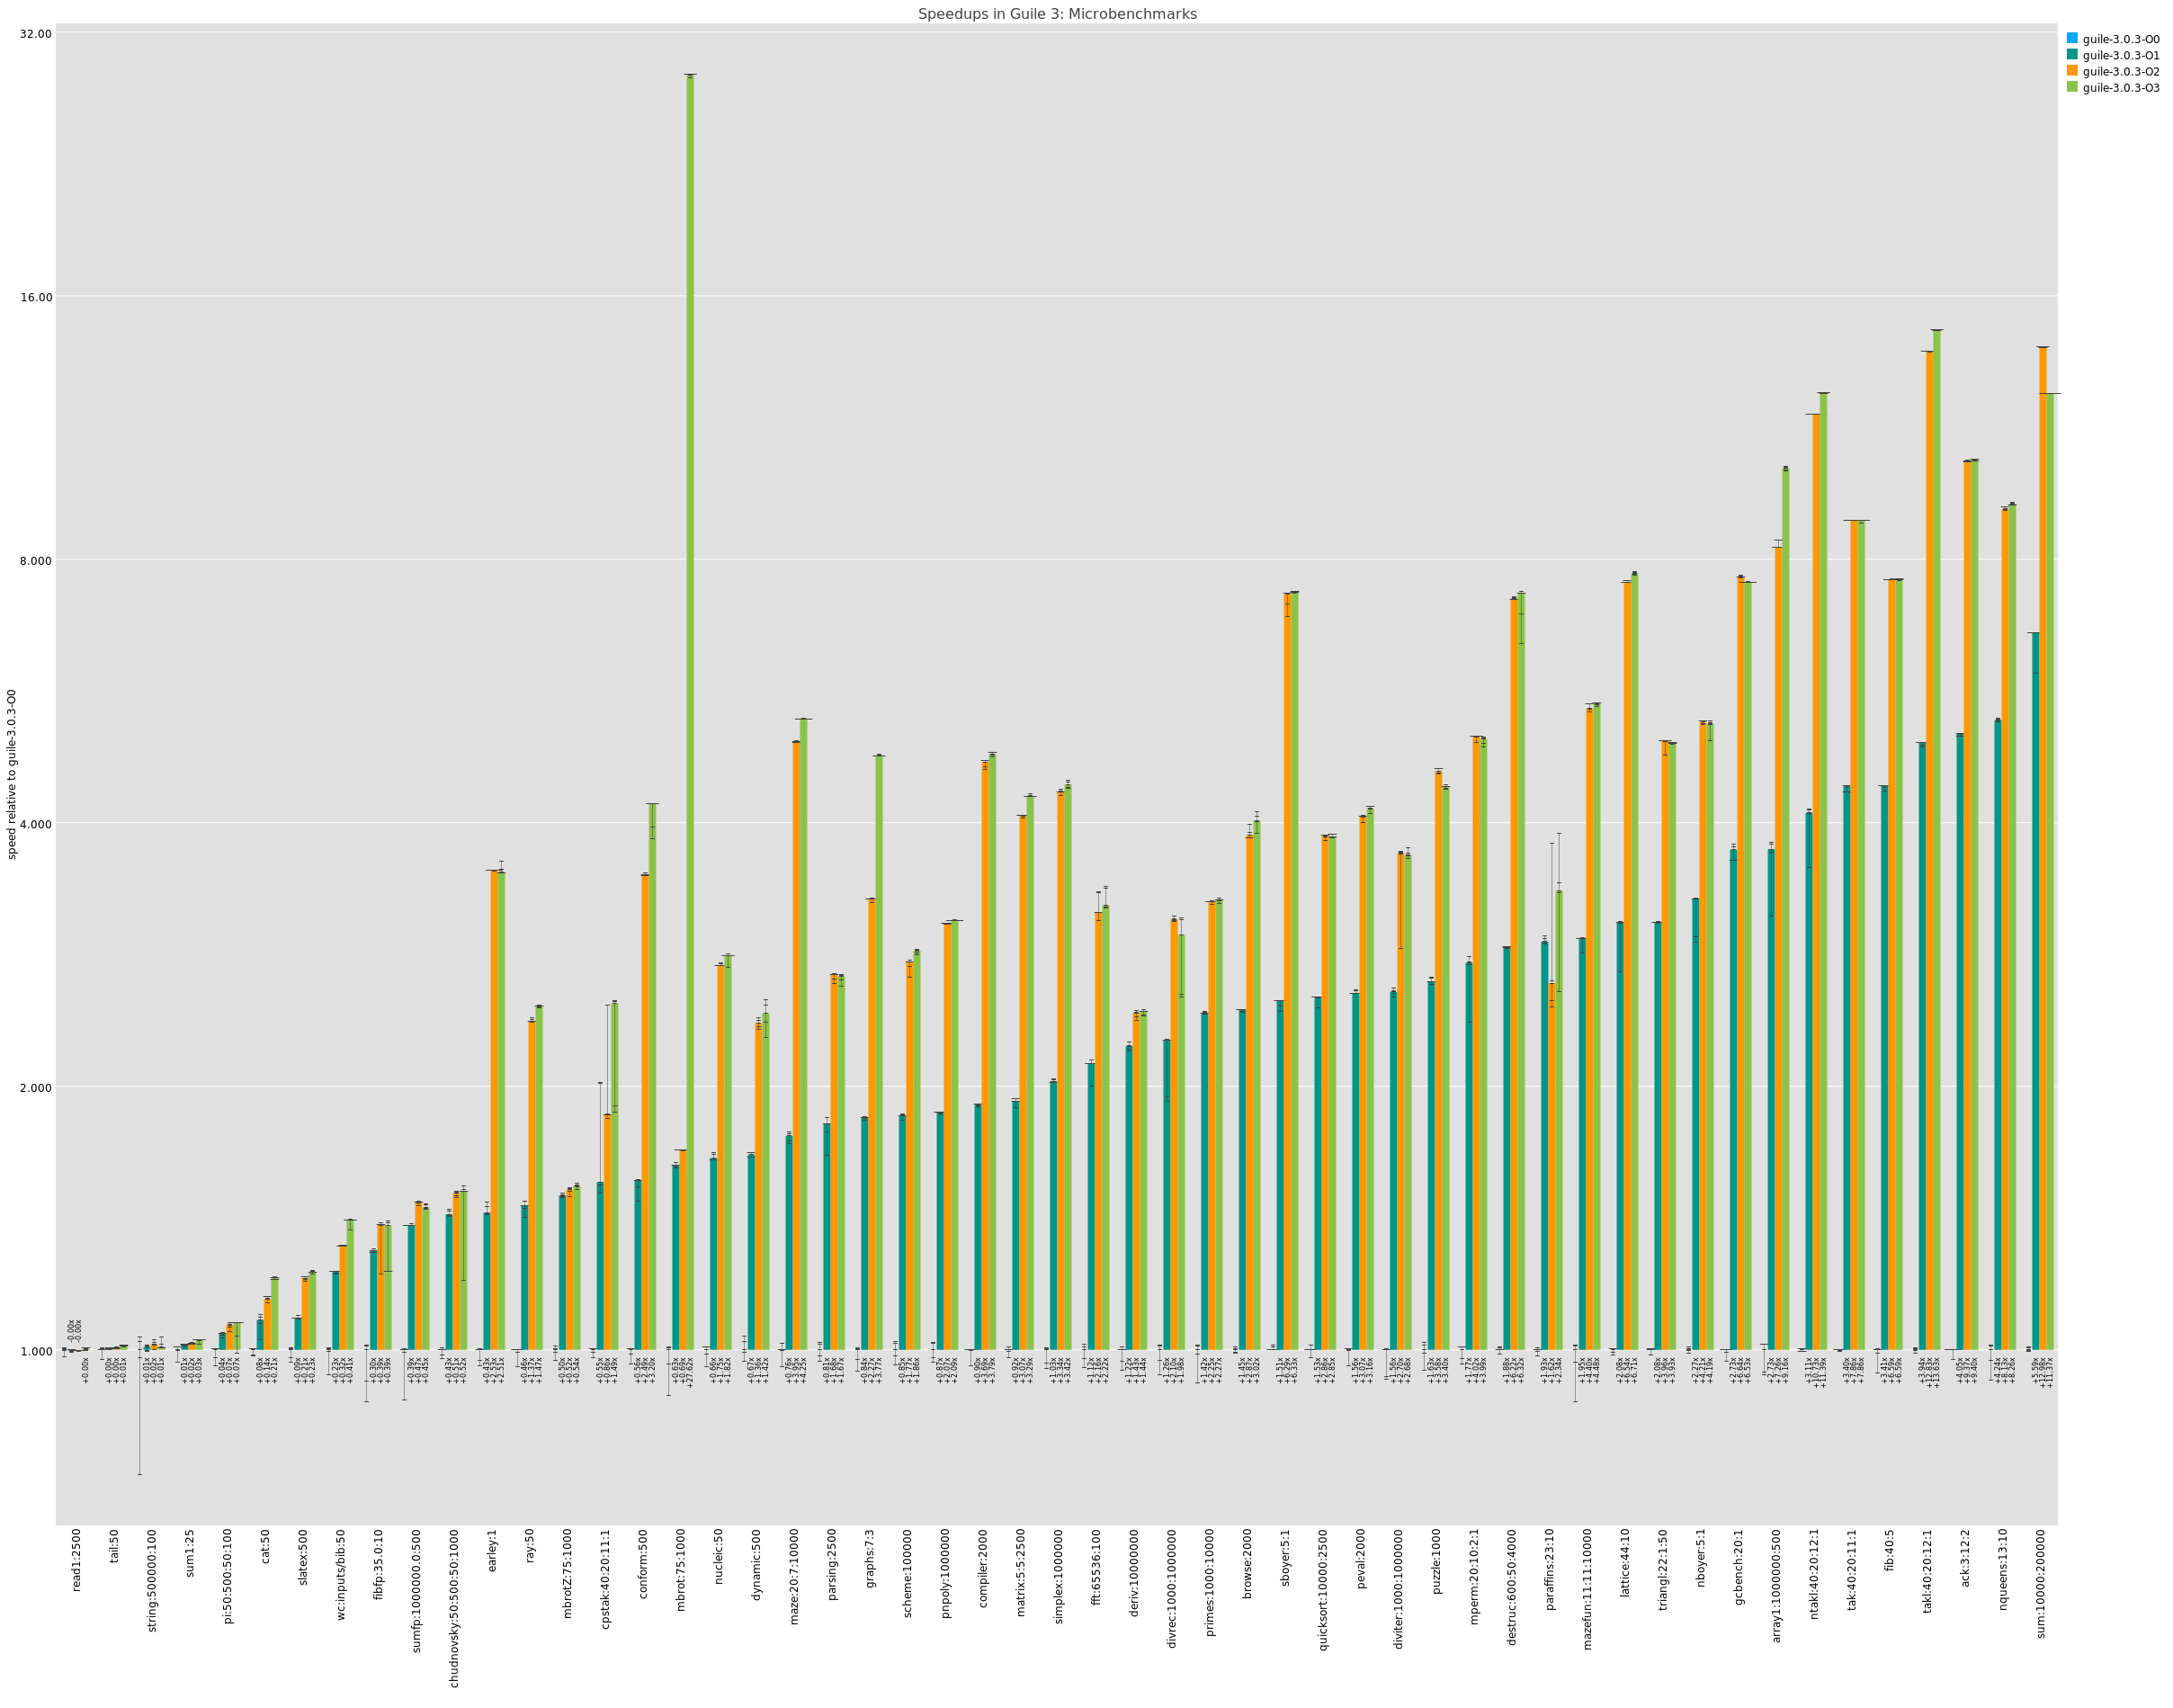
Like I said, it's gnarly, but the summary is that -O1 typically gets you a factor of 2 or 4 over -O0, and -O2 often gets you another factor of 2 above that. -O3 is mostly the same as -O2 except in magical circumstances like the mbrot case, where it adds an extra 16x or so over -O2.
worse is better
I haven't seen the numbers yet of this new compiler in Guix, but I hope it can have a good impact. Already in Guile itself though I've seen a couple interesting advantages.
One is that because it produces code faster, Guile's boostrap from source can take less time. There is also a felicitous feedback effect in that because the baseline compiler is much smaller than the CPS compiler, it takes less time to macro-expand, which reduces bootstrap time (as bootstrap has to pay the cost of expanding the compiler, until the compiler is compiled).
The second fortunate result is that now I can use the baseline compiler as an oracle for the CPS compiler, when I'm working on new optimizations. There's nothing worse than suspecting that your compiler miscompiled itself, after all, and having a second compiler helps keep me sane.
stay safe, friends
The code, you ask? Voici.
Although this work has been ongoing throughout the past month, I need to add some words on the now before leaving you: there is a kind of cognitive dissonance between nerding out on compilers in the comfort of my home, rain pounding on the patio, and at the same time the world on righteous fire. I hope it is clear to everyone by now that the US police are an essentially racist institution: they harass, maim, and murder Black people at much higher rates than whites. My heart is with the protestors. Godspeed to you all, from afar. At the same time, all my non-Black readers should reflect on the ways they participate in systems that support white supremacy, and on strategies to tear them down. I know I will be. Stay safe, wear eye protection, and until next time: peace.
One response
Comments are closed.
We're always talking about the trade-off between optimization and debugging. I understand why: the flow-graph analysis done by the compiler can reorder or constant fold code in such a way that a source level-debugger behaves poorly. But I've never been particularly fond of using such tools.
Your blog posts hint at a possible solution: can we not embedd some information from the optimization passes into the debugging section which can highlight which expressions have been inlined, constant folded, partially applied, etc. The compiler could, in fact, provide an actual *trace* of exactly how constant folded code was evaluated to the debugger.
If there's one thing that godbolt proves, it's that many many programmers are very interested in derailed feedback about what the compiler has chosen to do with their code. We could be on the threshold of a new era of "static debugging".
Speaking of a hot mess, the spam in your comments somehow manages to get past the numeric captcha. Time to evolve.